
When the Foundations Keep Shifting – Geolytix Town Boundaries
One of, maybe the, biggest headaches working with reference data is change. Houses get built, roads are widened, people die and babies are born.
15th April 2013 • GeoData

As providers of data it is our responsibility to keep on top of all this change.
Last week we finished the latest update to our town boundaries data product. There were over 2,000 individual changes to the town extents primarily reflecting new housing developments. 22% of the houses built in 2013 across England and Wales fall outside a 2013 Meridian2 sprawl. Only 1.7% fall outside one of our 2013 sprawls. For anyone trying to do identify growing towns these differences are critical.
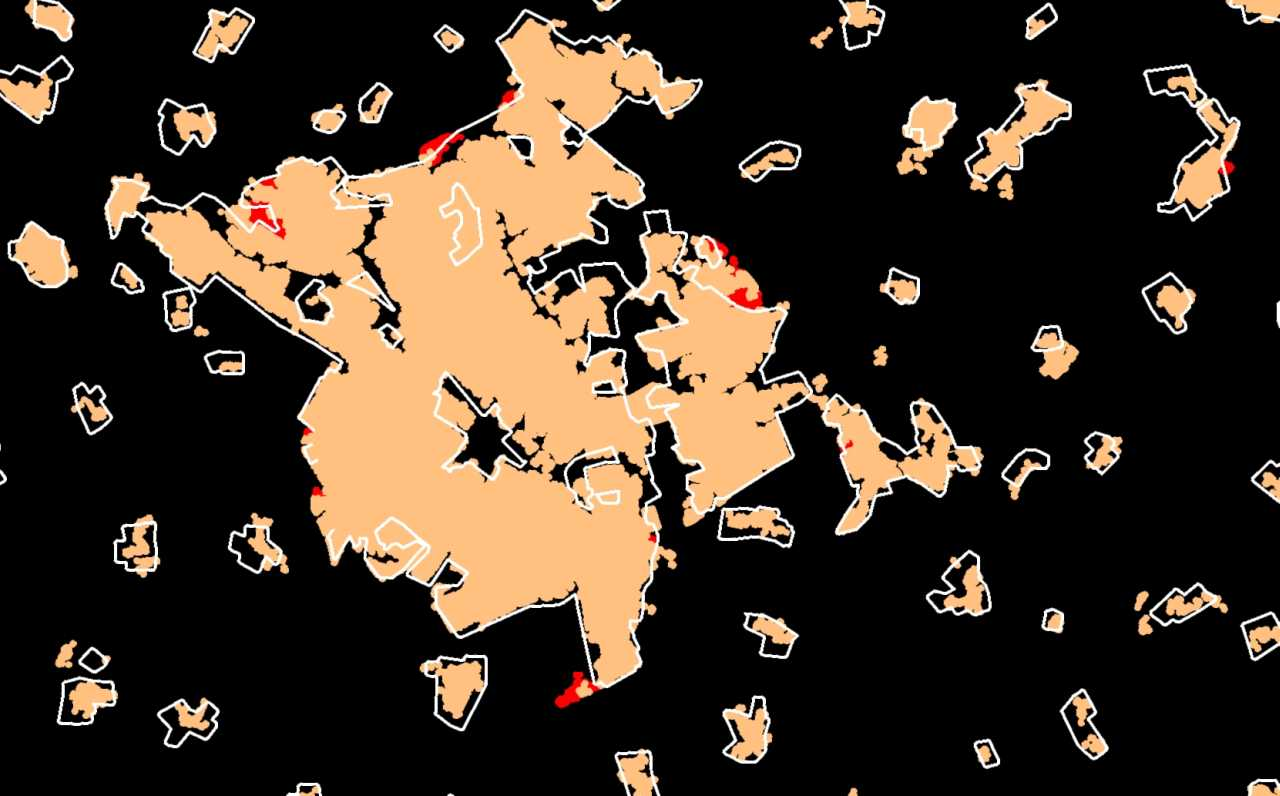
For example, here is our 2012 Milton Keynes in delicate peach with the new 2013 sprawl growth shown in red and the 2013 Merdian2 urban boundary shown as a white line.
Our sprawls were already the most intuitive and comprehensive set of town and suburb boundaries we know of, but now we can say they are also the most up-to-date. That’s good news for anyone trying to analyse the UK by coherent spatial units that mean something to the public.
This update took advantage of the OS Vector Map District release from March 2013, the February 2013 ONS postcode directory, and all new build houses extracted from the Land Registry data up to March 2013. The suburbs which nest within the largest 35 cities were also re-build to take into account new developments.
Map image contains Ordnance Survey data © Crown copyright and database right 2013, Royal Mail data © Royal Mail copyright and database right 2013, National Statistics data © Crown copyright and database right 2013.
Photo by Benjamin Elliott on Unsplash

Related Posts
-

Fast Food in Reading - A National Benchmark?
Using Geolytix Retail Universe, Josh maps the UK’s fastest-changing QSR hotspots and where the next wave of growth may emerge.
Published 23rd June 2026 • Tags market-visits, geodata
-

Grocery Growth: UK Supermarket and Convenience Changes in 2026 Q1
Convenience-led growth and selective closures have defined the UK grocery sector in the first quarter of 2026, as retailers continue to reshape their store networks.
Published 30th April 2026 • Tags open-data, geodata
-

Beyond footfall: where retailers really outperform in London
Card spend data reveals where London retailers actually outperform their own estates. From high-conversion rail hubs to high-productivity retail parks, discover the locations driving real growth.
Published 16th February 2026 • Tags geodata