
Bank Branch Data Open and Free from Geolytix
We are making the last 5 years of canonical UK bank branch data fully open under a CC0 license. It includes all UK branches - including those now shut - that have traded over the last five years. Read for more information...
23rd September 2021 • Open Data

Penguins famously and adorably form huddles to thrive in the Antarctic cold. Bank branches in the UK do the same. I can say this with 100% authority because I have worked with the canonical data for currently trading banks and those that have shut in the last five years. You can check my workings, in fact you can do or commission whatever analyses you want because Geolytix are making the last five years of canonical UK bank branch data fully open under a CC0 license. Maybe you think measuring the penguinness is best measured with a simple median nearest neighbours over time (my preference), or Moran’s I of hours, or maybe Ripley’s K. Without this data we are releasing today you really won’t get far, with it and the statistical world is your oyster.
Access to cash and wider financial services are topics exercising many. The latest government consultation closes on Thursday 23rd September 2021. We hope making this data open and available to all helps everyone involved make evidence-based commentaries and decisions.
The first immutable law of data analysis is inputs drive everything. No data equals no analysis, no models and no stories. Are banks preferentially closing in less affluent areas? Are Post Offices well positioned to serve the newly bank-branch deprived? How many people now live a mile further away from a branch than five years ago? Are particular brands behaving differently? What characteristics unite towns with no branches? Without knowing where branches are and have been you really have no chance answering even these simple questions, let alone constructing and conveying the rich customer and business story of how networks evolve.
This newly open data has all major UK branches (including those now shut) that have traded over the last five years, and comes with lat/longs, trading hours, and closure date where relevant. We have also added distance to nearest Post Office branch (trading as of Sep 2021).
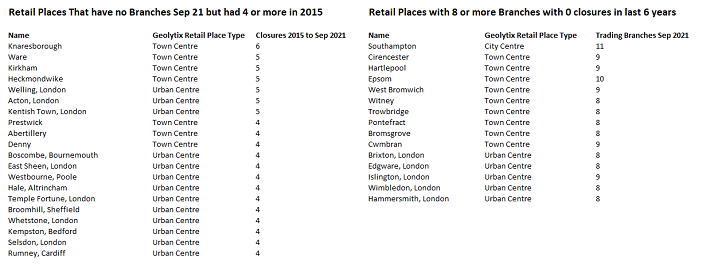
For the record the briefest of answers to those questions above are No, Oh Yes, about a million, a bit but not massively, smaller towns in the shadow of bigger ones.
Below, maps visually show what the data is telling us - and this is where the penguin reference really makes sense. Banks that are in the outlying villages/towns are typically the first to close, with those in a more central location remaining open for longer.
You can download the latest data and supporting documentation here*. Please @Geolytix on LinkedIn to let us know how you are using the data. Email info@geolytix.co.uk for any further information.
*This link will always have the latest version of data, even if updated after the publications date of this blog.
Blair Freebairn, CEO at Geolytix
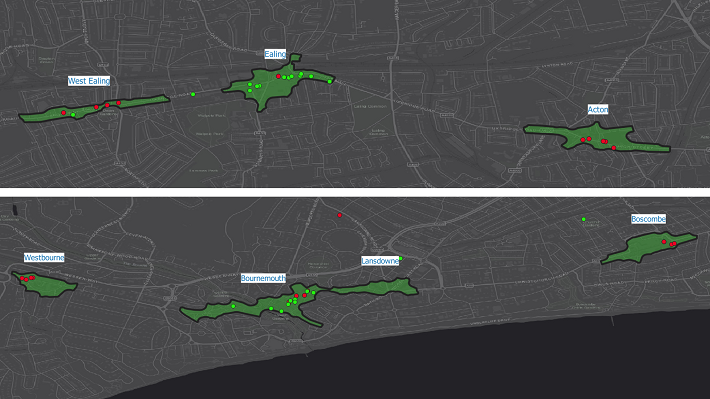
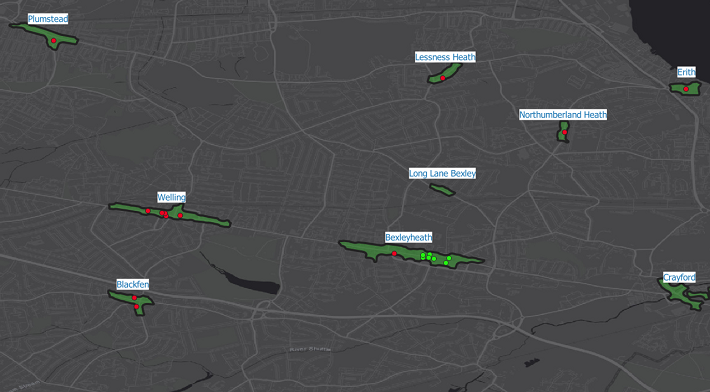
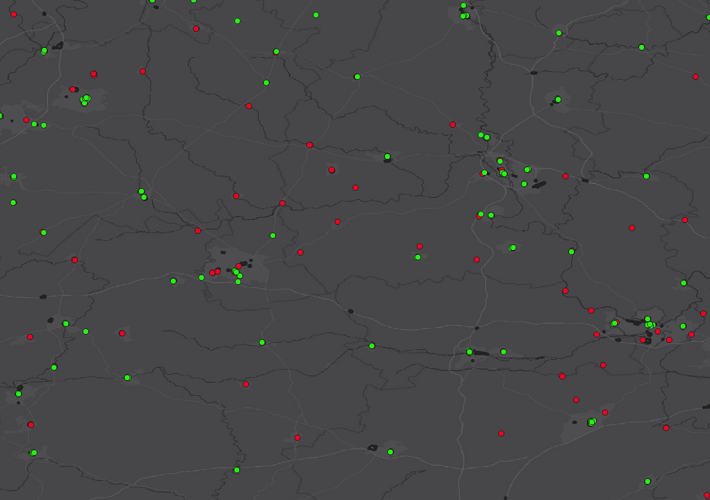
Photo by Martin Wettstein on Unsplash

Related Posts
-

Your Complete Guide to UK Banking Location Data
An overview of the uses of banking location data and how it can support mapping, analysis and planning across a range of projects.
Published 18th November 2025 • Tags open-data, geodata
-

Grocery Growth: UK Supermarket and Convenience Openings in 2024
2024 saw major shifts in UK grocery retail with bold expansions, innovative formats, and strategic closures shaping the industry.
Published 31st December 2024 • Tags open-data, geodata
-

UK Bank & Building Society Locations
Bank & Building Society locations across the UK. A reliable, openly available resource that gives users the ability to integrate this data into their work.
Published 26th July 2023 • Tags open-data