
The Big Spend: Highlights from the Data Science Hackathon
Each year we host a Data Science Hackathon. Danny shares the theme for this years.
16th April 2026 • Our Team

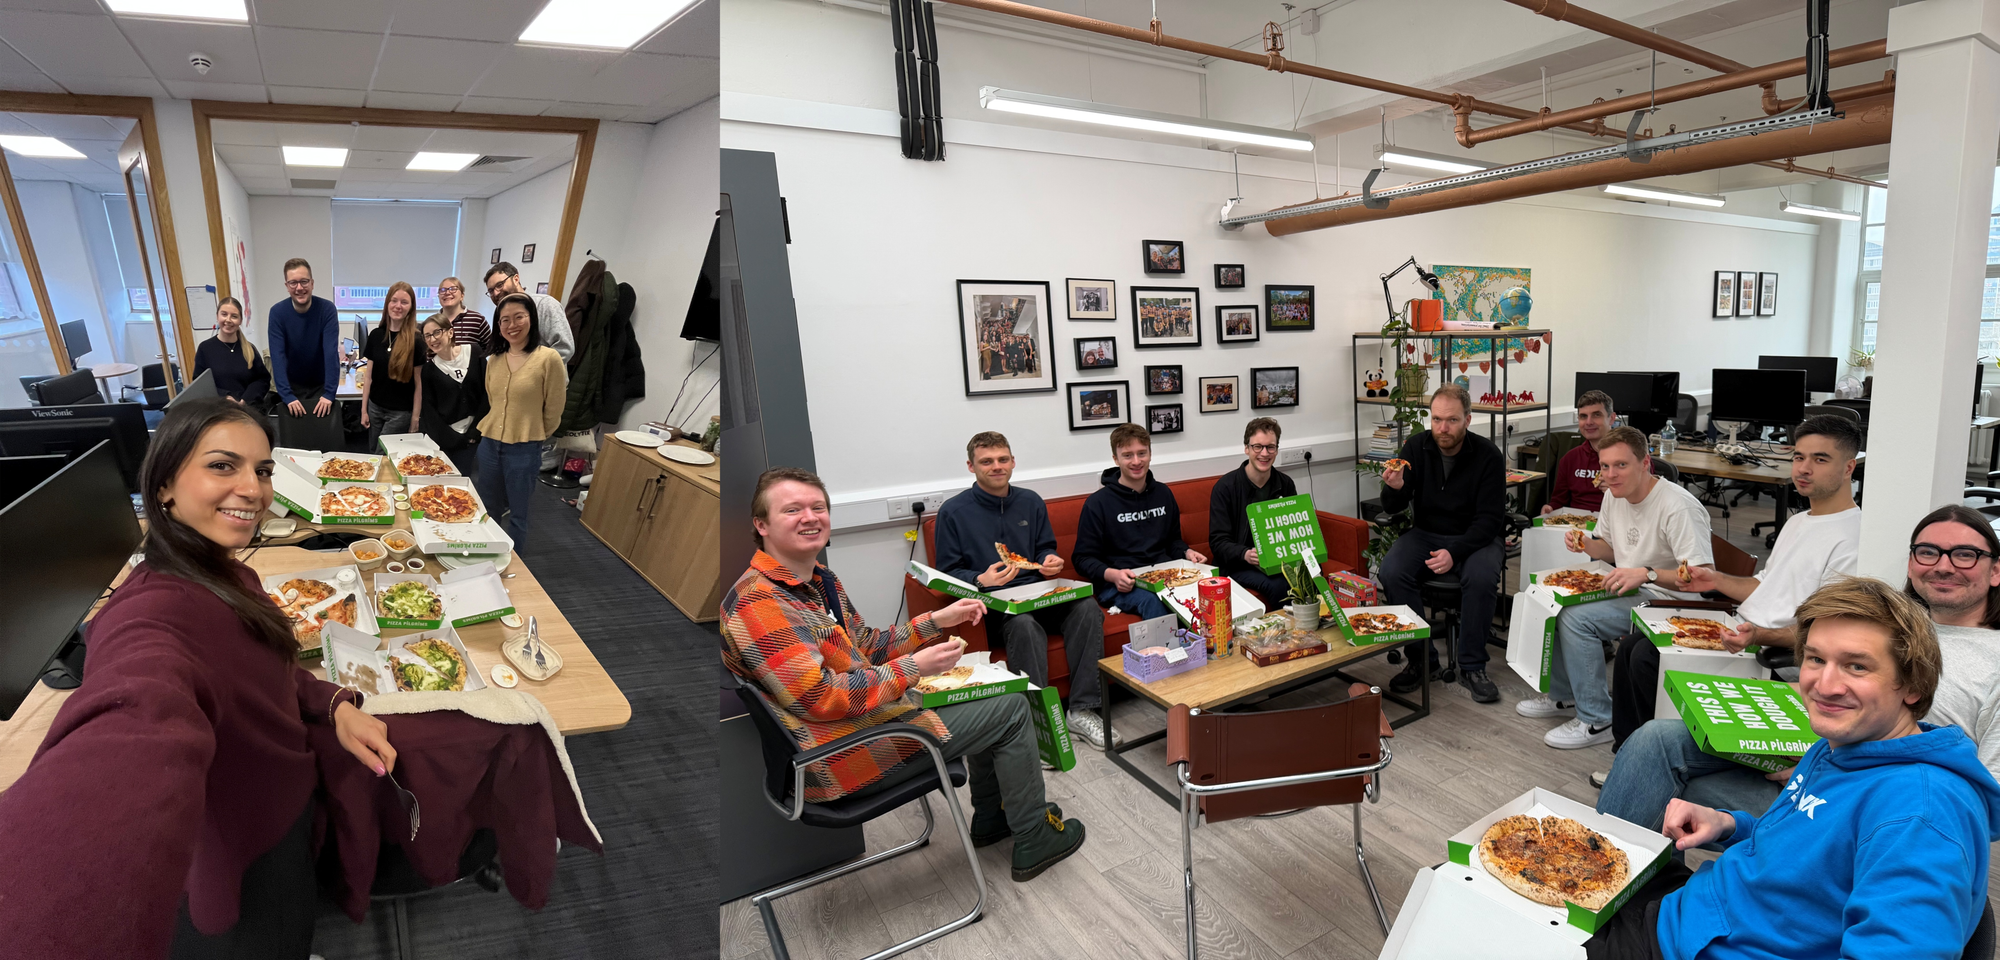
Last month marked a bit of a landmark at Geolytix, with our 5th annual Data Science Hackathon. The general idea behind these is to take a day out from our usual project work, give the team the opportunity to try different techniques and really explore tools and data without the pressures of a deliverable output.
In previously years this has included more traditional data science challenges like regression, segmentation or classification problems. This year though, the theme was a little different.
The Theme: Card Spend Data
With ever increasing interest in our unit level card spend data, there was a lot of internal excitement on how we might continue to explore the possibilities beyond the obvious applications. For those unaware, our anonymised card spend data offers a detailed view of the UK retail landscape, for over 200,000 individual retail units. The breadth, granularity and temporal nature of this data opens up a world of possibilities for location planning purposes.
The well-trodden use cases of understanding customer spend by brand and location (including for competitors), are of course very useful for solving network planning problems, but what else can we do?
With the theme set, we broke up into teams of two, to see what we could come up with in a day. Each team was then also required to present back their experiments and ideas with some key members of the wider Geolytix team. I’m always amazed by the quality and quantity of good ideas that are generated during our hackathons, despite the obvious time limitations.
The Experiments:
Some of the experiments covered this year included:
- Using temporal data to capture store/competitor opening dates to assess impacts.
- Assessing closure rates by shopper town, and analysing which features may help explain variations in regional closure rates.
- Exploring catchments derived from banking data, and analysing how these vary by brand, industry and Retail Place type.
- Examining temporal trends at unit level, to benchmark and compare individual store trends against those in close proximity.
- Building demand surfaces using banking data (or refining existing approaches).
- Exploring how and why seasonality patterns might differ at a granular level, even within the same town.
- Profiling customers for a handful of example brands, using only banking data.
Looking Ahead:
All of this generated much food for thought for the wider business, but also for the Data Scientists involved in ongoing projects. Watch this space for some enhanced products coming soon!
I do think it’s important to be able to step back occasionally or try to tackle a problem in a new way. In addition to our yearly hackathon, we also have an annual Data Science day, where we plan similar activities, but in the field, so expect another post later this year!
If you’re reading this and think this sounds up your street, we publish any available roles on our website.
If you’re reading this and want to know how card spend data could help your business, get in contact today!
Danny Hart, Head of Data Science
Title Image: Photo by Mika Baumeister on Unsplash

Related Posts
-
Employee Benefits at Geolytix
If working with an awesome team on interesting projects isn't quite enough, Geolytix employees benefit from lots of other perks too.
Published 5th January 2026 • Tags our-team, career
-

GEOLYTIX and the 30 Day Map Challenge 2025
Daily social mapping project happening every November: https://30daymapchallenge.com/. The fourth year we have joined this as a team, see all our maps here.
Published 10th December 2025 • Tags geodata, our-team
-
The Worlds Favourite Habit: Coffee Around the World
Thirteen weeks, thirteen countries, thirteen stories of coffee culture, rituals and connection from around the world.
Published 22nd April 2025 • Tags our-team, international