Life After Lockdown
Anecdotally, town and city centres have been busy since England Lockdown 2 ended last Wednesday. We’ve been busy processing up mobility data from Saturday to see what it tells us about the 18,000 Retail Places we monitor.
9th December 2020 • GeoData

This is all based on week-on-week movements – so comparing activity levels to the previous Saturday.
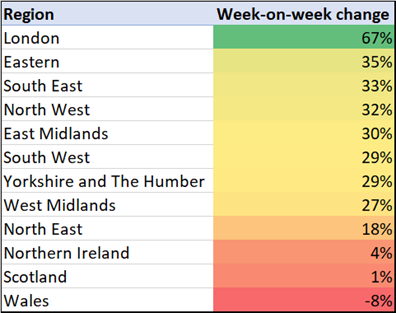
Here we go; firstly by Region:

-
London bounceback is by far the strongest in % terms – albeit coming off the lowest base. London West End numbers were up by more than 250% against the previous Saturday – but again, bear in mind this is off a base recovery hovering around 5% of pre-Covid levels
-
Northern Ireland, Scotland and Wales are obviously on a different phasing, which is (reassuringly!) reflected in the numbers.
-
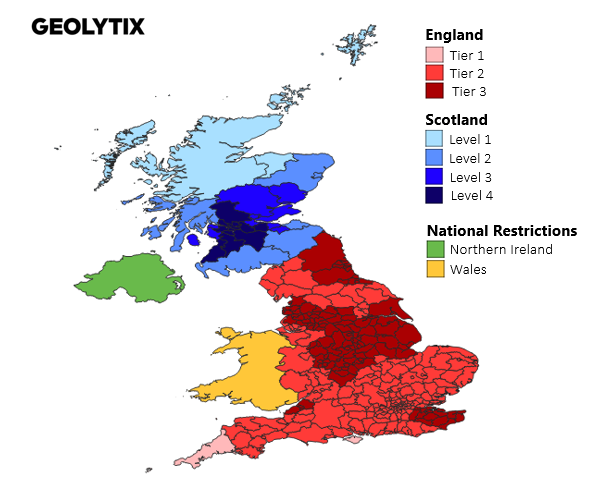
There appears to be a correlation between the regions that have returned from Lockdown - into Tier 3 restrictions, versus those in Tier 2 – although the differences in week-on-week change are perhaps not as pronounced as we might have expected.
-
The City Centres in England with the lowest week-on-week movements were all in Tier 3 regions; Coventry, Bristol, Middlesborough, Bradford, Leeds, Manchester and Newcastle – but even these saw week-on-week increases ranging from 50% to 75%.
-
On the flip side, places like Chester, Bath, and Liverpool – Tier 2 City Centres but in close proximity to Tier 3 regions, saw the biggest increases, all up >150% week on week.
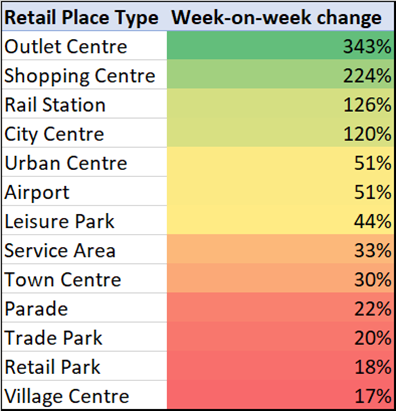
And then by Retail Place type:

-
Unsurprisingly, the Retail Places that were entirely closed down by the Lockdown saw the biggest week-on-week jump – Outlet Centres and Shopping Centres.
-
Beyond this, there was a clear trend back towards the bigger Retail Places – City Centres activity levels increasing at a much higher % rate than Town Centres.
The full weeks numbers will give us a more complete picture next week; watch this space.
But if there are any specific Village Centres, Town Centres, City Centres, Parades, Retail Parks or Shopping Centres you’re interested in, contact us through email, LinkedIn or Twitter with the names, and we’ll send you the detail on them.

Ben Purple, Director at GEOLYTIX
Image: Photo by Finn Hackshaw on Unsplash

Related Posts
-

Your Complete Guide to UK Banking Location Data
An overview of the uses of banking location data and how it can support mapping, analysis and planning across a range of projects.
Published 18th November 2025 • Tags open-data, geodata
-

From Footsteps to Forecasts: The Power of Small Area Footfall
Discover how Geolytix footfall data can transform the way you understand your locations and identify where to open next.
Published 30th May 2025 • Tags mobility, geodata
-

Grocery Growth: UK Supermarket and Convenience Openings in 2024
2024 saw major shifts in UK grocery retail with bold expansions, innovative formats, and strategic closures shaping the industry.
Published 31st December 2024 • Tags open-data, geodata